


This week’s FreightWaves Supply Chain Pricing Power Index rose to 40, up from 35 last week, signaling a modest shift in pricing leverage toward carriers. Driven by tender rejection rates surging to their highest levels in over two years, this change reflects tightening capacity in the truckload market. However, the overall picture remains challenging for carriers, with volumes dipping ahead of the holidays and spot rates showing mixed trends.
Declining Volumes and Market Fluctuations
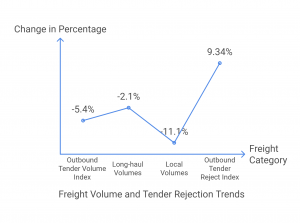
The seasonal holiday slowdown has caused a notable drop in freight volumes. The Outbound Tender Volume Index (OTVI), which measures national freight demand, fell 5.4% week over week and is down 2.43% compared to last year. Long-haul volumes experienced the least decline, falling 2.1%, while local volumes dropped a significant 11.1%. Despite the current softness, analysts expect a rebound after the holidays, though questions remain about the strength of the recovery and the pressures impacting the first quarter of 2025.
Tender rejection rates, a critical measure of relative trucking capacity, tell a different story. The Outbound Tender Reject Index (OTRI) increased by 286 basis points to 9.34%, marking a 449-point increase from the previous year. Notably, this rise was widespread, with 121 of the 135 freight markets reporting higher rejection rates. Major markets such as Chicago, Los Angeles, Dallas, and Atlanta all saw significant increases, indicating tighter capacity across the board.
Reefer Market Tightens, Van Market Follows
By mode, the reefer market continues to lead in terms of tender rejection rates. The Reefer Outbound Tender Reject Index surged by 704 basis points to 21.24%, more than doubling compared to the same period last year. Dry van markets also showed tightening, with the Van Outbound Tender Reject Index climbing by 243 basis points to 8.3%. This marked a 362-point increase year over year, signaling a positive trend for carriers in this segment.
Flatbed tender rejection rates showed slight improvement, rising by 80 basis points to 13.76%. While flatbed capacity remains project-dependent, upcoming Federal Open Market Committee projections for reduced federal funding cuts may challenge growth in this segment beyond 2025.
Spot Rates and Contract Rates
Spot rates retreated slightly this week but remain elevated compared to last year. The National Truckload Index (NTI), including fuel and accessorials, dipped by 9 cents per mile to $2.43, still 18 cents higher than this time last year. Contract rates, excluding fuel, showed minimal change, stabilizing at $2.34 per mile—2 cents higher year over year.
Notably, certain lanes are experiencing significant rate changes. The Los Angeles-to-Dallas lane saw spot rates climb to $2.77 per mile, 28 cents above contract rates. Conversely, the Chicago-to-Atlanta lane witnessed a slight dip in spot rates to $2.67 per mile, though the narrowing spread between contract and spot rates suggests a tighter market in the coming months.
Outlook for 2025
As tender rejection rates and spot rates rise heading into the holiday weeks, the trucking market is set for a tighter environment in 2025. Seasonal weaknesses in January may provide temporary relief for shippers, but continued upward pressure on rates and capacity constraints could create a more competitive market dynamic.
Source:
https://www.freightwaves.com/news/carriers-clawing-back-some-pricing-power


Leave a Comment